Author: James Clark

Understanding who comes to your site, how they get there, and then how they interact with it gives you crucial information for optimizing your site for search, and for future users.
This knowledge is key to improving your site content and its functionality. In order to do this, you will need data from site analytics tools, among them Google Analytics.
NOTE: Google's Universal Analytics is set for deprecation on July 1, 2023. Refer to our guide on getting started with Google Analytics 4 for the most up-to-date guidance.
What is Google Analytics?
Google Analytics is a powerful web-based tool offered by Google to help you understand your website’s users—where they come from, what they do on your site, and whether they are converting.
If you’re finding Wix Analytics Reports useful but really want to dive deeper into your data, then Google Analytics could be for you. It is also a good option if you’re already using other Google products such as Google Ads, as it’s designed to work together with these products to help you gain more insight into your marketing activity.
Although Google does offer a premium version of Google Analytics, called Analytics 360, this is an enterprise-level solution with an enterprise-level price tag. The standard Google Analytics is both free and suitable for most websites, so that’s what we’re focusing on here.
Google Analytics isn’t the only analytics tool available, and it isn’t even the only free tool, but it is certainly the most popular. With a huge community of users and lots of guides and resources available, as well as easy integration with Wix, it’s an obvious choice.
What about Google Analytics 4?
There is a lot of buzz—and confusion—about Google Analytics 4 (GA4). Google first introduced the next generation of its analytics platform in October 2020, but it will continue to support Universal Analytics (the version of Google Analytics that this article focuses on) until July 1, 2023.
That essentially means that on July 1, 2023, Universal Analytics will stop processing hits and site owners must switch over to GA4.
Why not start with Google Analytics 4 now?
Some of the functionality that marketers and site owners might look for isn’t available yet in GA4.
Nevertheless, it's a good idea to set up your GA4 property as soon as possible so that you can start keeping track of how users interact with your site. This will also enable you to get acquainted with the interface, which is a departure from Universal Analytics.
You can simultaneously maintain properties for your site on Universal Analytics and GA4—this provides you with the robust features of Universal Analytics while preparing you for the inevitable transition to GA4.
Creating your Google Analytics account
To use Google Analytics with a Wix site, you’ll need a Premium site with a connected domain. The process has two steps. First, create your Google Analytics account and get your tracking ID. Then, enable Google Analytics on Wix and add your tracking ID. Here's how to do both.
To create a Google Analytics account, you’ll need a free Google account. If you use Gmail, then you probably have one already, but if not, you can sign up for one here.
Next, follow these steps:
Go to analytics.google.com
Click on the blue Start measuring button
Give your account a name—maybe use your own name or the name of your business—and click Next
Enter a property name—this could be the name of your website
Important! Click Show advanced options and toggle on Create a Universal Analytics property
Enter your website's URL, including the www
Select Create a Universal Analytics property only (there's no harm in creating both a Google Analytics 4 and a Universal Analytics property, but we're going to focus specifically on Universal Analytics for this article)
Provide some basic information on your business as prompted, and hit Create
Choose your country, then read through and accept the relevant data processing and data protection terms
Congratulations—you’ve created your first Google Analytics account and property. You should now be on the “Tracking Code” page, and in the top left you’ll see a Tracking ID in the following format:
UA-123456789-1
Make a note of this, as you will need it in a minute! The letters “UA” at the beginning tell you this is an ID for a Universal Analytics property. If your ID begins with a “G”, you’ve created a Google Analytics 4 property instead.
Adding your tracking ID to Wix
Now that you have your Google Analytics property set up, completing the process on Wix is relatively straightforward.
Log into Wix and go to Marketing & SEO > Marketing Integrations
In the Google Analytics panel, click Connect
At the top right, click Connect Google Analytics
Paste in your entire Google Analytics ID (for example UA-123456789-1)
Click Save
Verifying your setup
It typically takes 24 hours for data to start showing up in most of your Google Analytics reports. The exception is the suite of “Real-time” reports—reports that show you what’s happening on your site right now. Data appears in these reports straight away, making them perfect for checking that your setup is working correctly.
In the vertical menu on the left, click on Real-time to open up the category and then click on Overview. This particular real-time report shows you, among other things, page views on your site as they happen. In most cases that includes your own page views, unless you are specifically filtering them out or are using a browser that blocks Google Analytics. So, go ahead and view a few pages—the data should appear in the report.

Finding reports
The next step is orienting yourself in Google Analytics. All the reports are listed in a vertical menu on the left-hand side of the interface. Aside from the real-time reports, there are four other categories of standard (i.e., predefined rather than custom) reports:
Audience—who are my users?
Acquisition—what are my sources of traffic?
Behavior—what do users do on my site?
Conversions—are users completing important actions, or “goals”?
Each of these categories can be useful for understanding the effectiveness of your SEO activity. For example, you might want to know what proportion of traffic comes from organic search (Acquisition) and the landing pages those users come in on (Behavior). Next, you might want to look at how many purchases those users are making, or how many inquiry forms they’re filling out (Conversions).
If you’re looking for a specific report but can't seem to find it, just type the name into the search box at the top of Google Analytics and click on the suggested matching result. The search box is also smart enough to understand questions about your data, such as:
How many users did we get last month from the UK?
What percentage of users were from organic search?
What is my most popular landing page?
Just type in your question and hit enter to open the “Insights” panel. As well as (hopefully) answering your question, this panel will provide you with a link to the most relevant report and suggest some follow-up questions you might want to ask.
Working with a report
You have a question about your site and you’ve found the most relevant report. Now, you need to analyze the data in that report to tease out your answer. But, how?
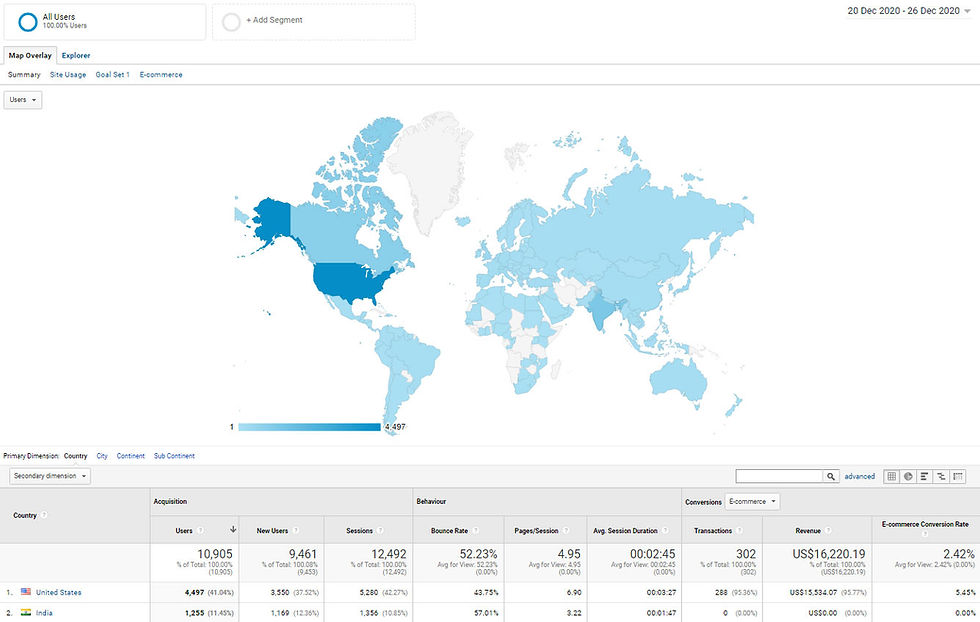
For this example, we'll look at the Location Report (in Audience > Geo > Location), which shows the geographical location of your site's visitors.

First, select a date range in the top-right. By default, the report will show the most recent seven-day period, but this is easily changed by picking a new start and end date. Tick “Compare to” if you want to compare, for example, the last 30 days against the same period last year. Perhaps you’ve noticed high traffic levels from Canada recently—comparing against a previous period will let you see whether this is an anomaly.
Just below the main chart is an option to choose the “Primary Dimension.” Google Analytics reports are all made up of “dimensions” and “metrics”; without getting too complicated, think of these as rows and columns of a table. For the Location report, the default primary dimension is “Country”—but you could change this to “City”, “Continent,” or “Subcontinent”.
If you drill down into the data, the dimension may change automatically. For example, click on “Canada” in the Location report and the primary dimension changes to “Region.” This lets you see whether those Canadian users are all coming from, say, Ontario, or are spread out across the country.
To the right-hand side of the Primary Dimension selector is a small search box. Unlike the large search box at the top of Google Analytics, this one is used to search and filter the data within the report. So, if you had a primary dimension of “City” selected, you could search for “Toronto” to see the data for that city only. Click “Advanced” if you want to search for more than one value (or rather, city) at the same time, or even exclude a particular value from your search.
Although we’ve been looking at the Location report, these options and filters are common across most of the other standard Google Analytics reports. So, getting familiar with one report will help you use the entire tool with confidence.
Accessing your data easily with Analytics
Now you know where and how to find the data you want, let's make sure you can easily access it in future.
The first option is simply to Save any report using the button at the top of the page. This adds the report to a list in Customization > Saved Reports. It also saves any search filters or other changes you have made to the standard report, which means you won't have to make those same changes again in future.
Alternatively, you can click on the Share button just to the right of Save. This lets you share a report (via email) but, more importantly, lets you schedule it to be sent out on a regular basis—daily, weekly, monthly, or quarterly. Once you set this up, you will be able to find and edit it (or delete it) under Admin > Scheduled Emails.

You can also set up Custom Alerts so that Google Analytics notifies you when certain conditions are met. This option is located in the Admin menu above Scheduled Emails.
For example, you might want to receive an alert when Google Analytics has received no data in any given day, indicating a problem with your site tracking—or perhaps with the site itself. Alternatively, you might want to be notified of any sudden, large changes (positive or negative) in your organic search traffic.
Next steps on your Google Analytics journey
If you’re serious about learning Google Analytics, take a look at the free video courses that Google offers in its Analytics Academy. These range from Google Analytics for Beginners right through to Google Analytics for Power Users. After that, you can even consider sitting the Google Analytics Individual Qualification exam and getting certified!
Ultimately though, Google Analytics is just a tool—it will help inform your SEO strategy but can’t compensate for not having one. To delve deeper into how to build and implement your own SEO strategy, visit our SEO Hub.
*You should make sure your use of Google Analytics is compliant with local data protection regulations. Learn more about this here.

James Clark is a web analyst from London, with a background in the publishing sector. When he isn't helping businesses with their analytics, he's usually writing how-to guides over on his website Technically Product. Twitter | Linkedin