6 SEO tools you can build with ChatGPT & Colab
- Gus Pelogia
- Jun 27, 2025
- 12 min read
Author: Gus Pelogia

Learning to code was an aspirational goal I had for years. I’ve tried many times across several coding languages, but didn’t quite learn enough to create the applications I had in mind. Declare variables? API? Test environment? I know the words and what they do, but I would quickly get frustrated with my broken code and move on to something else.
But that was all back when the only way to create applications was to pay someone or learn how to do it yourself. Large language models opened a new world of possibilities for people like me to write usable code and create small applications.
In this article, I'll show you how easy it can be to ask ChatGPT to write code for you and how to use Google Colab to simply copy and paste the code, creating a useful application in just a few minutes.
You’re free to use my prompts and applications or create your own improved versions. Depending on what you want to build, you’ll need two or three different applications:
An LLM to prompt and generate your code (e.g. ChatGPT)
A connector, like an API
Google Colab, available in Google accounts for free, to run your code
Table of contents:
What is a prompt?
If you use ChatGPT or any other LLM, you’ve already written prompts. A prompt is just what you ask the LLM.

Since prompting is a step into creating your own apps, here’s an example prompt I’ll explain with more detail later in this article:
I need a Python script that calculates and displays the cumulative percentages for both traffic and revenue, showing how many pages represent 20%, 40%, 60%, 80%, and 100% of the total.
Plot two graphs: one for cumulative traffic and one for cumulative revenue distribution across the pages. Find the URLs that represent 50% of the traffic and revenue.
Remember that you can keep iterating your prompt on ChatGPT and other LLMs. If you’re not happy with the results (i.e., your code doesn’t do exactly what you want), you can continue the ‘conversation’ until the results are satisfactory.
What is a connector?
For the purposes of this tutorial, a ‘connector’ is any external tool you need to collect information (e.g., an API or SEO tool). This allows you to pull information from a Google knowledge panel or extract vector embeddings using a crawler like Screaming Frog.
This is an optional step, depending on the tool you want to build. It can be as simple as providing the API key that requests the information you’re asking for.
Once we get to the examples, I’ll show exactly how to use them and how simple they are.
What is Google Colab?
First of all, Colab is short for “Colaboratory.” And, as described in its FAQ, “Colab is a hosted Jupyter Notebook service that requires no setup to use”.
In other words, it’s a Python environment that runs on your browser, requires no software installation, and comes with several pre-installed packages.
If you have a Google account (e.g., Gmail), you probably already have access to Google Colab. It’s free to use and you can share your code the way you would any Google Doc.
How to run your Colab notebook
Plain and simple:
You tell ChatGPT (or your preferred LLM) what you want in your code.
ChatGPT generates the Python code.
You copy and paste the code in Google Colab and click on “Run.”
While this is a straightforward task, errors are likely to come up. Don’t worry too much, because you can return to ChatGPT to identify errors and fix them.

Make sure to ask for “Python code for Google Colab,” so your code is limited to packages available there.

If you start getting errors, show ChatGPT which errors you had and it’ll adapt the code for you. It usually takes me up to three interactions to get the results I’m looking for.

Why use Colab instead of ChatGPT directly?
If ChatGPT is generating the code for you, couldn’t you just ask it directly for the results? The answer is yes, you could. However, not everyone is comfortable or allowed to upload their company data into ChatGPT.
Even with the option to prevent your prompts from being used to train models, I still don’t feel like uploading sales, revenue, or conversion numbers directly. This is a workaround, since the files are run in Google Colab, which uses your Google Drive or files you upload directly.
This way, ChatGPT will never see your data, so it couldn’t possibly train on it.
How to generate code for Google Colab
I hope you’re still hooked on the idea of creating your own tools. I explained all the technical steps above, but you still need to know what (and how) to ask ChatGPT to generate your code. Let’s focus on that now.
Depending on your use case, you’ll still need to learn some concepts or explain that you want to use a certain connector, like an API. Here’s an example:
Write a Python script that calls the Google Knowledge Graph API, searches for a specific query (e.g., 'Taylor Swift'), and prints the fields @id, name, @type, description, url, and resultScore.
In this case, I’m connecting to the Google Knowledge Graph API and need to know which fields are available to pull data from.
Sometimes an idea is clear in your head and, when talking to a human, you can make a lot of assumptions (e.g., your colleagues know what a ‘conversion’ means in your company), but the LLM doesn’t, so be very explicit in your prompt.
For instance, say things like:
Adapt this code to Google Colab
I will upload a CSV with headers [A, B]
I want a file that downloads automatically after the numbers are calculated
Combine both results in one CSV file
Change the input source to use Excel files
If your code doesn’t do what you expected, just ask ChatGPT your next request, copy and paste the new code and test again.

Example 1: Traffic and revenue overlap
A while ago, I was at a crossroads: we could only invest in optimizing a percentage of pages. One KPI was to protect traffic, another was to grow revenue. Not every page has the same potential, so how could I address both?
By creating a small app on Google Colab, I could upload all my data and put together some groups of pages showing the percentage of traffic represented by those groups.
I found that 20% of the pages represented nearly 80% of all traffic. You can find your ideal group (e.g., 50% traffic, 50% revenue) and drive the conversation with stakeholders by proposing to only optimize a percentage of pages and listing exactly which ones.

Prompt example
I need a Python script for Google Colab that can:
Calculate and display the cumulative percentages for both traffic and revenue, showing how many pages represent 20%, 40%, 60%, 80%, and 100% of the total.
Plot two graphs: one for cumulative traffic and one for cumulative revenue distribution across the pages. Find the URLs that represent 50% of the traffic and revenue.
Try to overlap URLs as much as possible, but it's ok if there's no perfect match. Traffic or revenue might be a little higher than 50%.
The input will be given by a CSV file I'll upload. Combine the URLs into one file and automatically export this data to a new CSV file.
Use your intuition to adapt this prompt to your needs. This prompt shows that you can create an application with graphs and how specific your prompt instructions should be.
You’re saying the results don’t need to be an exact percentage (which is nearly impossible to reach), that you’ll upload the data in a spreadsheet, and that you want the results to be downloaded automatically. This way, you’re not rambling through Google Colab to find where the file saved. While it’s not hard to locate the output file, this will save you a few minutes each time.
Beyond the table with the results shown above, you can also plot some graphics that will facilitate the conversation when you’re pitching an SEO initiative.

Example 2: Knowledge panel explorer
I’ve written on Wix about how to get a knowledge panel—this tool allows you to extract the confidence score Google has for specific entities, such as a person, company, or any other ‘thing’ (e.g., concepts, books, events, etc). Similar versions of this tool already exist, but I wanted to see if I could make my own just for the learning process. I also made an improved version where you can automatically track your confidence score daily, but let’s stick to the basics below.
Prompt example
Write a Python script that calls the Google Knowledge Graph API, searches for a specific query (e.g., 'Taylor Swift'), and prints the fields @id, name, @type, description, url, and resultScore.
If the query doesn't return a valid result, please print the message ‘Query is not present on Knowledge Graph panel’.
This is meant to work on Google Colab.
This is a case where you’d use a connector—the Google Knowledge Graph API.
To get an API key, to create your own Google Cloud API. It’ll generate an API key (a random mix of letters and numbers, such as 4gD2yB5lf9rqWiAm2nqGCkTyoU3&2x) that you need to copy and paste into your code.


When you get it right, it should look like the example below:

Example 3: Best and worst month analysis
This is an example of how a small application can save you precious time.
Traffic and conversions to different pages go up and down at different times. If you’re analyzing to find out when pages performed the best, the first step is to know when a page was at its peak and then compare your ranking positions at that time vs. now.
This is quick to do for a handful of pages, but if you need to find the best and worst months for hundreds of pages, just finding the dates is a manual and boring task—all of that before analyzing what happened and putting together a recovery plan.
This tool looks at your full list of pages and extracts the best and worst month for any metric (traffic, conversions, revenue), as long as the data is present in the source.
Prompt example
Write a Python script for Google Colab that checks the best and worst month of traffic for a URL. I'll upload a CSV file with Date, URL and Sessions headers, including sessions for every month over a large period.
Once you read the data, automatically export a CSV file including the Date, URL and Session for the best and worst month for every URL.
The output should look like this:

You can make adjustments on how you want to display the data, but this looked good enough for me. The first column is the URL, then the month, and number of sessions.
Example 4: Crawler with AI prompts
There are plenty of SEO crawlers on the market, so I’m not suggesting you should create your own to compete with them. I just wanted to see if it's possible to create a simple crawler that would extract the page content and pass through a ChatGPT prompt, all in a Google Sheet. It works, and it is surprisingly easy!
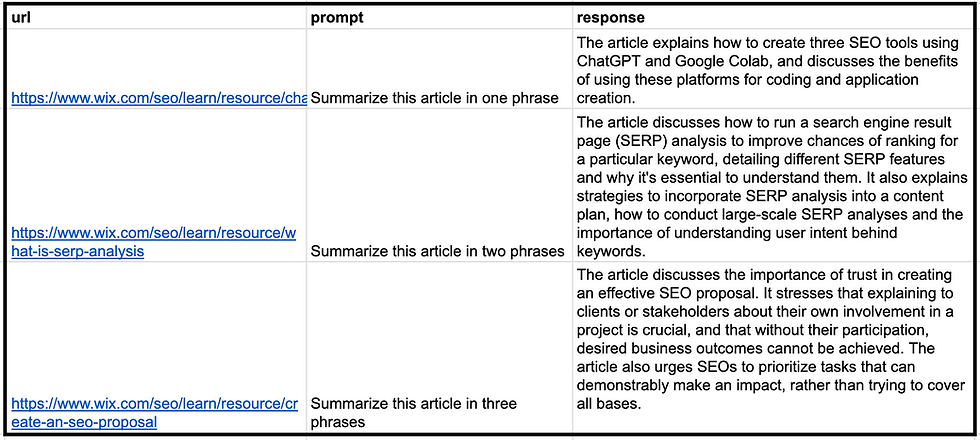
The prompt example you see below worked in the first attempt. Always keep in mind that LLMs are overly confident. Sometimes you could ask it to read the content inside a URL, and it would throw an answer, even though it didn’t really read it.
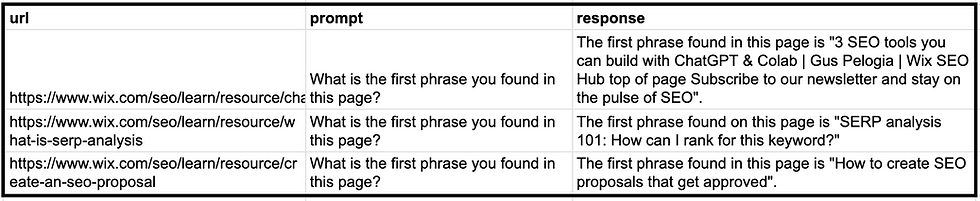
I tested this one more time, asking for the first phrase in each article. If it had hallucinated, it’d be easy to spot. Now I know it’s actually reading the page since these are exact phrases that exist on each crawled page.
One of the most popular SEO crawlers in the market, Screaming Frog, has multiple AI-related features where you can do the same as I did here, and much more. For instance, you can extract only segments of a page (e.g. exclude headers and footer, for example), generate alt text automatically and plenty more using OpenAI's API.
If, for some reason, you can’t afford a license or need a free option (apart from the OpenAI API keys usage), this could do the trick.
Prompt example
Please write me a Python code to use with Google Colab.
I'll provide you with a URL, which you need to crawl / scrape the content. The URLs are in column A.
Then, run this by the prompt in Column B. This will make a call OpenAI (I'll provide an API key) and return the answer in a CSV.
Example 5: ChaptGPT query extractor
As everyone in SEO is currently trying to discover how ChatGPT works and influence how their brand and clients are mentioned, multiple SEOs took Chrome Dev Tools (a feature inside Google’s browser, Chrome) to find clues.
One of these SEOs is Jérôme Salomon. He found out that ChatGPT breaks our long requests into multiple phrases and sends them to Bing to fetch relevant sources (URLs).
You can replicate these findings by prompting on ChatGPT. After that, click with the right button on your browser, then choose Inspect > Network > “Conversation” > Response
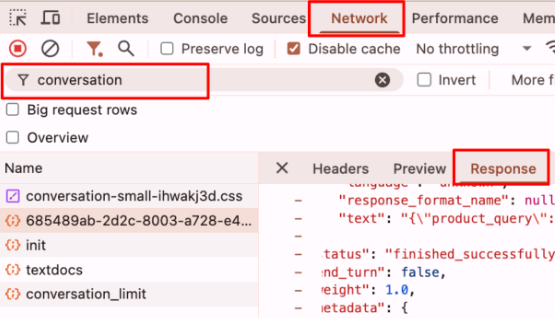
This process happens when ChatGPT needs to consult external sources to validate its answers and display the sources (URLs) to users. This process is part of an AI framework known as RAG (Retrieval-Augmented Generation).
Another SEO professional, Ziggy Shtrosberg, used an LLM to create a bookmarklet you can add to your browser and after doing a search on ChatGPT, you simply click on the bookmarklet and the queries ChatGPT made to Bing are revealed.
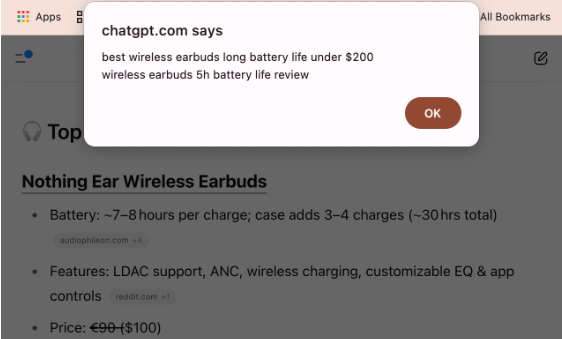
Ziggy said his process included asking Claude (another LLM) what he wanted, doing one step at a time, and testing it. After reading his blog post and some others on this topic, I learned that the information I want is under a field called search_query. Trying to replicate his steps, I simply asked for a JavaScript bookmarklet that would extract this field in any page (or return an error message).
While Ziggy's tool has a better design, I still managed to extract the same information with a two-line prompt. The hardest part was discovering what I should ask.
Prompt example
I want to create a javascript bookmarklet to add on Chrome.
It should extract the contents inside search_query.
Example 6: Find related articles
This is a more advanced case that I already covered in another blog post, but it was very popular at the time, so it’s worth a mention. You can map pages with similar topics together by using vector embeddings and cosine similarity. This allows you to find related products, add internal links, off-topic pages, and more.
In short, vector embeddings are a numerical representation of text that captures its semantic meaning and relationships. This way, you can analyze what a whole page is about. Then, use cosine similarity to compare these pages to each other to find out how similar or different they are.
I used Screaming Frog as a connector. They have a feature where you can crawl a page and extract the embeddings at the same time. You could also create a small crawler that extracts vector embeddings to work directly on ChatGPT or on your Google Colab. Remember that you only need to add your API key, press the play button on Google Colab, and upload your spreadsheet—nothing too complicated.

You can even reuse the prompt in example 3 (Crawler + AI) and run everything on your own machine. I've tested and got an error (“You tried to access openai. Embedding, but this is no longer supported in openai>=1.0.0”).
To solve it, I've fed the error to my conversation with ChatGPT and got an updated code that works. Here's the Colab Script if you want. Simply add your API key and a spreadsheet with the header “url”.
The next step is to use this other Google Colab script to measure the cosine similarity between each page and find the three most similar.

Prompt example
Please write me a Python code to use with Google Colab. I'll provide you with a URL, which you need to crawl / scrape the content.
The URLs are in column A. Then return the embeddings for these pages in column B. This will make a call OpenAI (I'll provide an API key) and return the answer in a CSV.
Use a newer version of the openai library (v1.0 or above)
Experiment, validate, and iterate to maximize LLMs for SEO
Beyond the examples I shared above, this post was meant to inspire you to come up with your own applications based on your specific needs. Start simple, test the tools, and whether the results are actually correct (LLMs sometimes have too much confidence, even if they’re plain wrong).
Remember, you can ask for text, tables, graphics, and pretty visuals. There are advanced cases, such as content decay, that also help you tell a story to stakeholders, and making it visual is a great way to strengthen your recommendations. Even a color scale on a table can make a huge difference, and you can ask ChatGPT to include this in your code.

Some of these apps may look very simple, not fully fleshed like the SaaS tools you may be used to, but they are still an improvement from your spreadsheet or manual work. They may be shared in your company or remain your secret. Either way, you can build something powerful!


Gus Pelogia - SEO Product Manager Gus Pelogia is a journalist turned SEO since 2012. He’s currently an SEO product manager at Indeed, the top job site in the world. Every day, he writes tickets for small and large initiatives and works in a cross-functional team with writers, UX, engineers, and product managers.


